


The Downturn in Perspective
By now you know that market timers and traders were spooked once again, causing a downward ripple across the U.S. investment markets. It’s not easy to tell what startled them this time. The financial press told us that the reversal was brought on by the release of the August Consumer Price Index report, but one wonders how, at this point, a month-to-month continuation of inflation is much a surprise. And the report was hardly dramatic; the CPI was up 0.1% from July, after no change from the prior month.
Even though the markets dropped just over 4% in one day, when the dust cleared, the S&P 500 index was still only 0.33% below where it had been the previous Wednesday. Other signs are definitely less gloomy. Gas and energy prices have been dropping, the employment rate has been consistently high, and economists now believe that higher wages have become the top driver of inflation—which cannot really be bad news for consumer spending and the overall health of the economy. Indeed, retail sales increased 0.3% in August, which took many economists by surprise.
All of that said, the U.S. economy does seem to be experiencing a slowdown that could (emphasize could) lead to a recession. The problem for investors, though, is that the stock market tends to be a leading indicator of economic slowdowns, rather than something that follows on—meaning that, in the past, markets have recovered during recessions as investors start to see the light at the end of the tunnel. This makes predicting future market movements, using economic data, virtually impossible.
And, of course, predicting anything based on a startling of the herd of market timers and active traders is patently impossible. It’s natural to look at returns this year and want to stop the bleeding, but that would mean selling and taking the risk that the markets will suddenly startle in the opposite direction as traders and market timers experience a sudden fear of missing out on the next upward movement.
If you think that anyone can successfully time the exits and entrances in a way that would avoid downturns and capture upturns, then stop and think for a moment, and try to name a famous, successful market timer.
If such a person existed, he or she would not only be right at the top of your mind, but also fabulously wealthy. The fact that nobody comes to mind, coupled with the fact that the most successful investors of the past have consistently preached a buy and hold approach, suggests that people who have the fortitude to stay invested when stocks are on sale tend to come out the other side with higher account balances.
This can be seen on the historical return chart below, which not only shows the steady, incremental rise in stock values due to the daily efforts of millions of workers in tens of thousands of companies, but also how unpredictably the timers and traders can move the markets in the short term. Their impact is volatility and anxiety, not consistent wealth-building returns.
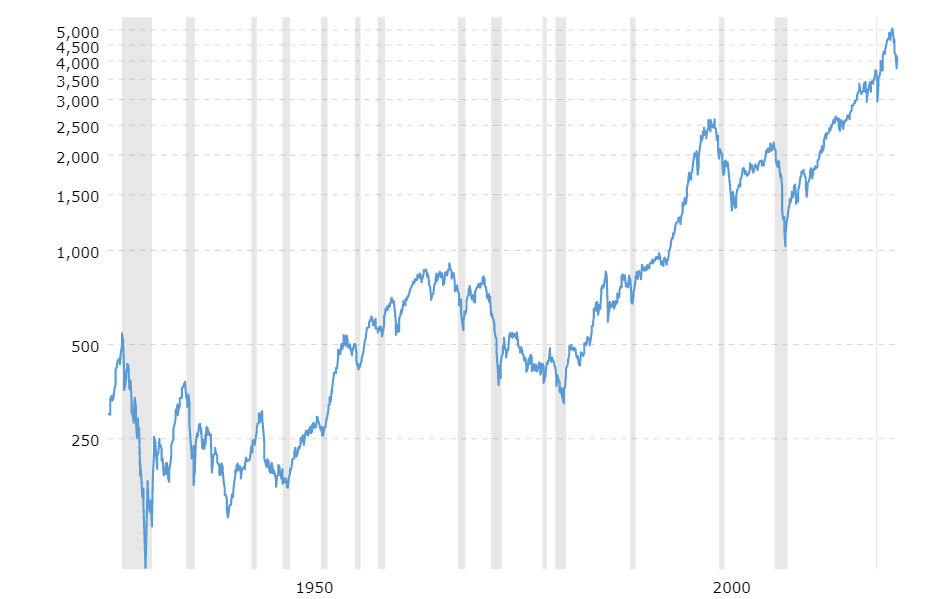
S&P 500 Index - 90 Year Historical Chart: The current price of the S&P 500 as of September 14, 2022 is 3,946.01.
During market volatility we always focus on the things we can control like anticipating cash needs. We appreciate your continued trust in our team and we welcome you to reach out should you have any concerns.
With gratitude,
Your Team at Beacon Financial Planning