


A Long-Term Perspective on Market Downturns and Historical Bear Markets
We hope this letter finds you in good health and enjoying the first few weeks of Spring! Along with the weather, the markets have been a bit sunnier lately - we've now experienced two consecutive quarters of healthy market gains. Let’s dive into the numbers…
The market gains in the first three months of 2023 were spread quite evenly across all sectors. The Wilshire 5000 Total Market Index—the broadest measure of U.S. stocks—gained 7.26% in the first three months of the year.
Large cap stocks, represented by the S&P 500 index gained 7.03%. The Russell Midcap Index is up 4.06% and the Wilshire U.S. Small-Cap index posted a 4.02% gain. The technology-heavy Nasdaq Composite Index, the biggest loser in 2022, came roaring back in the first quarter, posting a 16.77% gain!
Overseas, foreign markets moved in lockstep with the U.S. The broad-based EAFE index of companies in developed foreign economies gained 7.65% in the first quarter of 2023.
Despite the rise in interest rates (and higher loan costs), real estate securities produced decent returns. The Wilshire U.S. REIT index posted a 3.25% gain in the first three months of the year.
Looking at fixed income, bond rates rose dramatically last year, but that trend seems to have moderated. 30-year U.S. government bond yields are down slightly, from 3.96% at the end of last year to 3.65% currently. Now, here’s the interesting part: 10-year bonds are yielding 3.47% while 5-year government securities are yielding a higher 3.57%. Even higher are 2-year Treasuries which are yielding 4.03%, one-year government bonds are yielding 4.59% and topping out yield are 6-month securities at 4.86%. Whenever shorter-term bonds are paying bond investors more than their longer-term counterparts, it is called a yield curve inversion, and this has historically been the siren call for a looming recession.
So... are we heading that way? And maybe more importantly, given recent events, are banks safe anymore? Will the war in Ukraine jump the borders and lead to something more dangerous? When will inflation finally moderate?
Starting with the banking sector, where the run-on assets at Silicon Valley Bank was followed by problems at Signature Bank, First Republic Bank, Zions Bank and Credit Suisse, we understand that what happened is pretty simple; many lending institutions were sitting on unprecedented amounts of cash due to the Fed's response to the Covid pandemic, and some of them parked that extra money in long term bonds. Then suddenly rates went up and their bond investments dropped in value. The Federal Reserve Board has taken extraordinary measure to make sure banks have access to capital when they need it, and all depositors are insured up to $250,000 per account and at some banks your deposits can be insured for even greater amounts. You may read about other banks with troubled balance sheets, but it appears that this is not the recession trigger that it was once feared to be.
One might think that banking woes would have zero impact on the inflation rate, but in fact the two are connected. Inflation is running at a 5.4% rate over the past year and seemed to gain steam again in January. These across-the-board price increases are still well above the 2% target rate. In response, the Fed was expected to raise rates by half a percent, but decided, in light of the banking issues, to moderate the raise and in effect cut it in half.
Meanwhile, the 3.4% unemployment rate is the lowest we've seen since 1969. Labor markets are so tight that there are two jobs available for every unemployed worker right now--and workers are demanding, and receiving, salary increases. This dynamic will push up inflation by raising production costs.
What does this all mean for the months ahead? The future is always unknown, but the view ahead today is unusually cloudy. Bottom line, our creed has and will always be, that traditional asset allocation is not a broken or failed strategy in the face of market uncertainty. It will always make sense to think about balance, diversification, and risk. A one-size-fits-all approach doesn’t work for every investor. At Beacon, it’s about building portfolios from the bottom up that align with each investor’s goals.
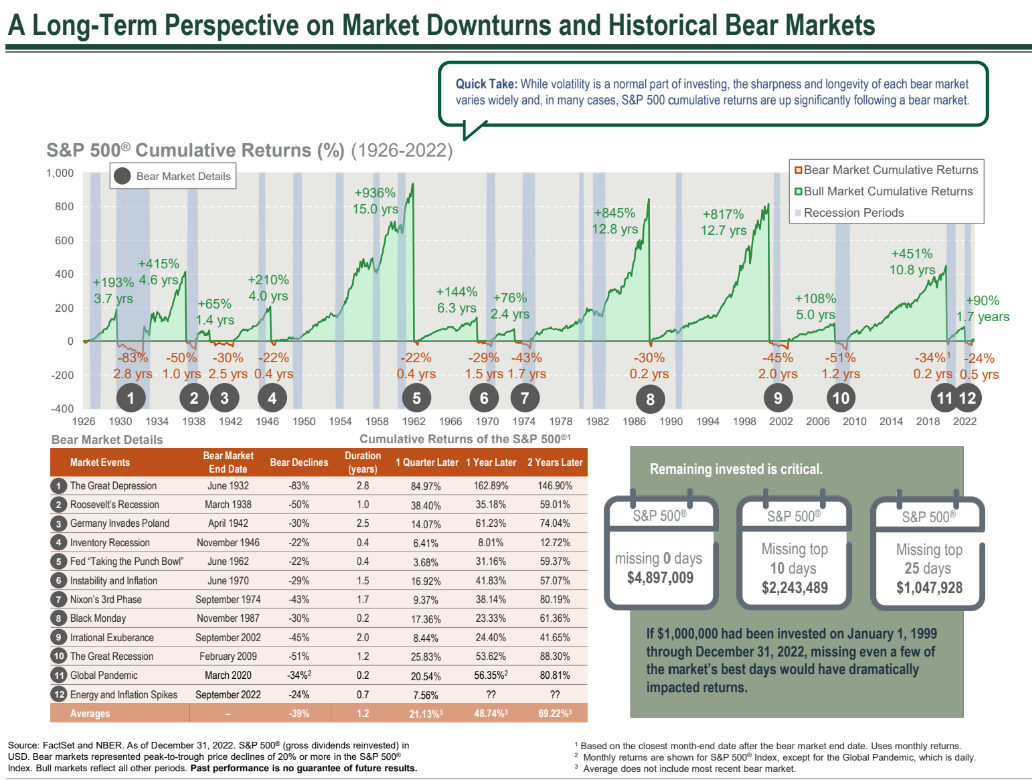
We’ll leave you with this great chart below outlining market returns 1 quarter, 1 year and 2 years after a market downturn.
Beacon Financial Planning ("BFP") is a registered investment advisor. Advisory services are only offered to clients or prospective clients where BFP and its representatives are properly licensed or exempt from licensure. For additional information, please visit our website at www.bfpcc.com. The views expressed in this commentary are subject to change based on market and other conditions. These documents may contain certain statements that may be deemed forward‐looking statements. Please note that any such statements are not guarantees of any future performance and actual results or developments may differ materially from those projected. Any projections, market outlooks, or estimates are based upon certain assumptions and should not be construed as indicative of actual events that will occur.
Sources: Bob Veres 2023 First Quarter Investment Report
Wilshire index data: https://www.wilshire.com/solutions/returns-calculator
Russell index data: http://www.ftse.com/products/indices/russell-us
S&P index data: https://www.spglobal.com/spdji/en/indices/equity/sp-500/#overview
https://www.marketwatch.com/investing/index/spx.
Nasdaq index data: https://www.morningstar.com/indexes/xnas/@cco/performance,
International indices: https://www.msci.com/real-time-index-data-search
https://www.advisorperspectives.com/articles/2023/03/27/first-quarter-2023-economic-review-and-forecast and AMG Funds Chart dated 12/31/2022